San Jose’s Housing Permits Fall Short -- Again
Scott Beyer, editor of the influential Market Urbanism Report, continues his close, metrics-based investigation of the local housing market, and comes up with another disappointing conclusion: Silicon Valley continues to underbuild residential construction, worsening its affordability crisis. An Opportunity Now exclusive.
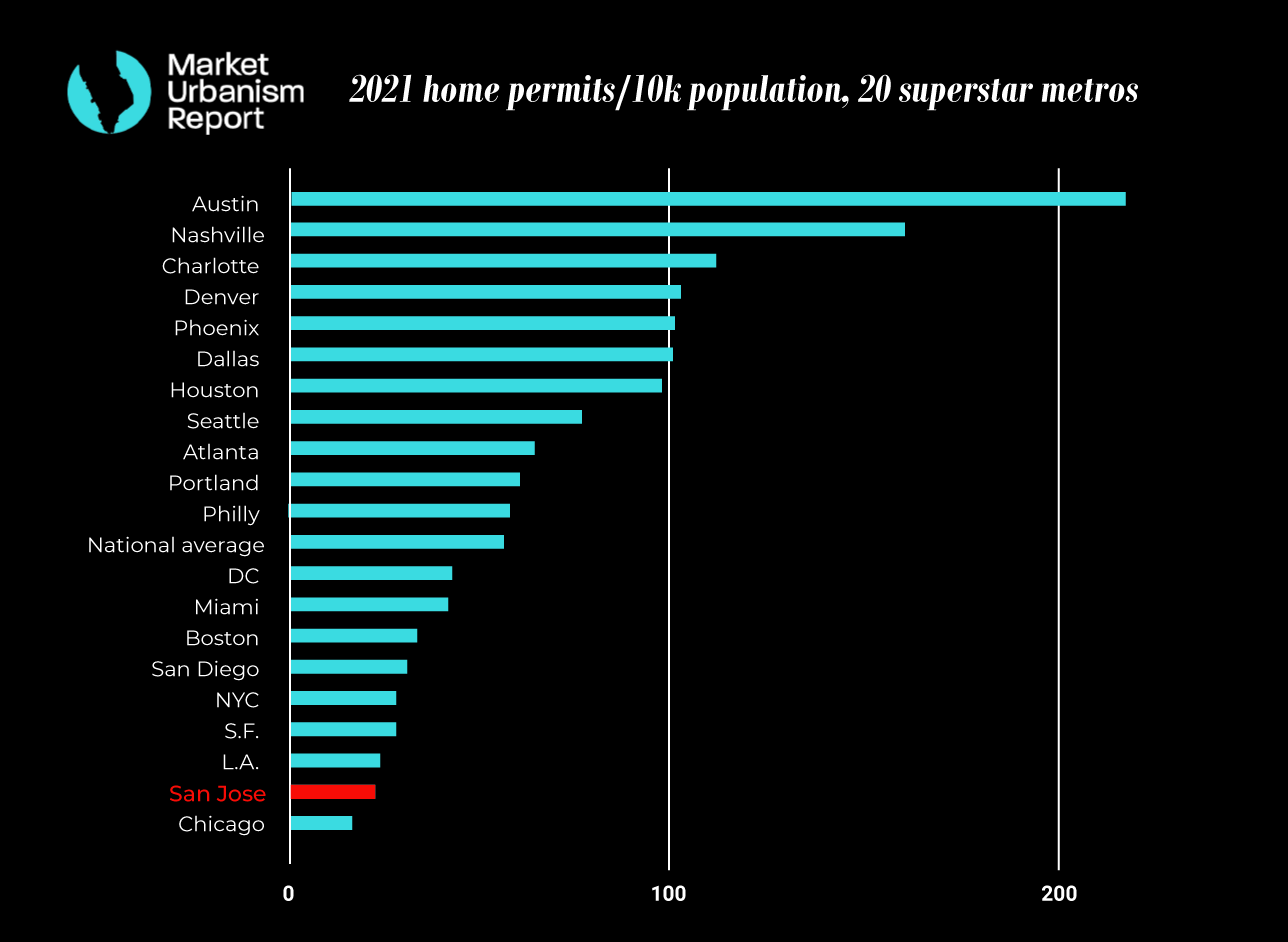
The best way to keep track of housing growth in a given metro area is to track permits. Fortunately, the U.S. Census Bureau makes it easy by collecting this data annually from all 384 metros, and in California, the state also tracks permitting by municipality. Every year when the data is released, dating back to 2004, Market Urbanism Report has tracked the permitting in America’s 20 “superstar” metros, that is, ones that have some combo of high population growth, strong economic activity, and/or a worldwide reputation. Then we calculate permits issued per 10,000 people, to get a sense of how rapidly metros are building relative to population size.
And every year, despite its economic importance to the country and the world, Silicon Valley performs poorly. In 2021, metro San Jose permitted a mere 4,529 units, or 23 per 10,000 residents; only Chicago performed worse out of the 20 comparable metros. By contrast, middle-American metros such as Austin, Charlotte, Nashville, Denver, and Phoenix permitted over 100 units per 10,000 people - and their median home prices are all far cheaper than San Jose’s $1.675 million.
This data is accumulated through surveys of permitting authorities, looking at another process known as the Survey of Construction, which tracks construction of single- and multi-family homes in the U.S., or is “imputed based on the assumption that the ratio of authorizations for the current time period to the prior year total is the same for reporting and nonreporting jurisdictions in that Census Region.”
California conducts its own surveys as well, providing a municipal- and county-level look at permitting. The state’s Department of Housing and Community Development publishes the figures, which are collected through a mandatory process that tracks home production. “This report includes data on jurisdictions’ progress towards their housing goals, including data on all housing development applications, entitlements, building permits, and completions,” explains the DHCD.
For 2021, 5,047 total units received permits in Santa Clara County, according to state data (local tallies can sometimes differ slightly from Census ones, given the timeframe for counting). The city of San Jose permitted only 1,671 of these, or 16.6 permits per 10,000 of the city’s total population of 1,003,120. 1,213 units were completed in San Jose in 2021, out of 3,505 countywide. Of the cities in Santa Clara County, only San Jose and Sunnyvale (1,414) permitted in the four figures. Palo Alto, for instance, permitted just 90 units, and only 70 were permitted in Campbell. For San Jose, this is a decrease from previous years - in 2017, San Jose built 2,788 units.
The city’s goals overall fall short too. As we wrote this spring, in late 2017 the city set a goal of bringing 25,000 units on line by 2023. That would mean 5,000 new units per year, which the city obviously is not meeting; since 2018, reports San Jose Spotlight, only 3,348 units were built under the program. It’s worth noting that even if San Jose achieved those 5,000 units annually, that would mean a 45.6 per 10,000 rate - still very low.
Other markets have performed demonstrably better. There is an obvious correlation from our Census data crunching between metros that permit lots of housing and ones with lower median home prices. Metro San Jose and San Francisco are, cumulatively, doing the worst in terms of affordability, and that’s because their permitting rates are also among the worst. And it bears repeating that all of these metros have heavy demand pressures - be it population growth, corporate relocation, or global reputation - hence the “superstar” moniker. But some of them have clearly done a better job of accommodating it.

The disparity is not just at metro level, but plays out at city level too. From 2009 to 2019, according to RENTCafe, Houston built 114,000 new apartments - or 11,400 a year. Denver, whose population is 76% of San Jose’s, saw over 12,000 apartments open in 2018. As a result, the average rent for a 1-bedroom unit is $1,381 in Houston, $1,973 in Denver, and $2,846 in San Jose (if anything, this suggests that Denver, too, should be building more).
As we wrote in a recent 3-part series, San Jose’s housing shortage is the reason why housing is so expensive in the city and region. Harsh regulations that discourage construction, and subsidies that are at best marginally effective and at worst counterproductive, exacerbate the shortage. The Census figures hammer this point home, and show that the problem really spreads across the entire Bay Area. As long as this government-created supply problem exists, it will continue to harm local cost-of-living and economic growth.
This article featured additional reporting from Market Urbanism Report content staffer Ethan Finlan.
Follow Opportunity Now on Twitter @svopportunity