☆ Expert: SJ Housing Dept chasing the wrong metrics

Image in Public Domain
It's a time-honored business nostrum that "you are what you measure." Housing expert Scott Beyer of the Market Urbanist takes a look at the beleaguered SJ Housing Dept's audit, and finds the organization's metrics confused, avoidant, and not very useful. An Opp Now exclusive.
San Jose this past September completed and released a long-awaited audit of the Housing Department. The audit, which itself was a meandering word salad, showed what an opaque and convoluted affordable housing strategy the Department has. While the Department, and the larger collection of municipal governments across Silicon Valley, could simplify the housing issue, there is an endless alphabet soup of complication. The performance metrics the Department uses, and that the audit focused on, don't really inform the overall mission of driving down regional home prices. And the convoluted language itself seems designed to camouflage that core issue.
In terms of progress on housing affordability, the audit’s findings tell the familiar story.
“On average,” it states, “in 2022, an apartment cost over $2,700 per month to rent in San José and the median home sold for nearly $1.6 million.” It reported that there are 6,300 homeless residents. This is despite the fact that the 2022–23 Housing Department budget “was over five times more than 2018-19 actual expenditures and 65 percent more than 2021–22 actual expenditures.”
Amazingly, this discussion of expenditures within the audit doesn’t delve into affordable housing project costs. According to the Spotlight’s Jana Kadah, “on average, the city spends $225,000 to construct a unit of affordable housing,” and spends even more on its “interim housing” program when accounting for ongoing operating costs. You’d think a comprehensive audit on performance metrics would address this issue head on.
After noting that the city has failed to meet the goals of its recent state-mandated housing elements, the audit highlights the lack of a more realistic “interim goal.” Looking again at homelessness, the city and Santa Clara County have established plans to reduce homelessness 30% annually. The auditors report that while San Jose tracks homeless individuals and total units built, it does not clearly track how or whether these measures work towards the yearly 30% goal.
Housing metric overload
Where metrics exist, they are convoluted and opaque. The auditors note that there are over 200 of them, “which mostly do not align across the Department’s different reporting platforms.” Much of the reason, as the audit mentions, is that the Department must report on various esoterica as a condition for receiving federal grants.
While it’s understandable why the Department would track participants in a given homelessness alleviation program or data on loans issued, what isn’t apparent is the goal of said programs, and whether spending on them is meeting those goals. In an email provided to Opportunity Now, Roberta Moore, District 10 Commissioner, noted that each program needed such explicit definitions as well as hard data on expenditures, how many units were brought online, and how many people they helped.
“Without these clear quantifiable goals and costs, there is no objective measure of success and no way of demonstrating results, value and performance,” Moore said.
Other metrics just seemed tedious: number of social media followers the Housing Department had, number of Rent Stabilization Program hotline inquiries, loads of laundry provided by Dignity on Wheels.
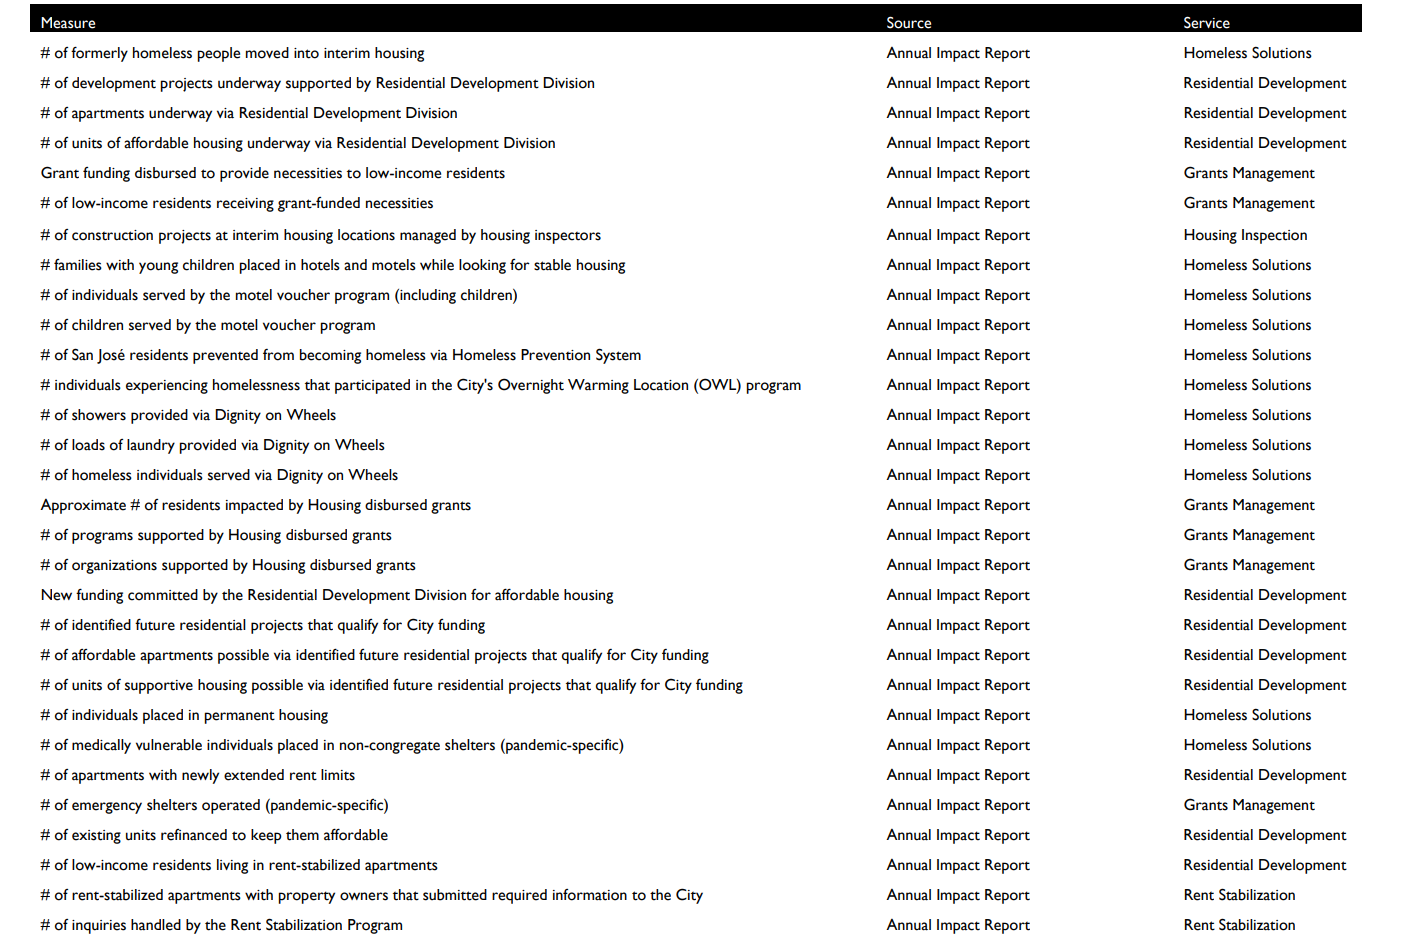
A partial list of the metrics the San Jose housing authority tracks.
The authors agree that this is a problem, claiming performance metrics should include “direct outcome of a policy program or process.” But the Housing Department doesn’t seem to do that sufficiently on its own.
The audit concludes...
The report makes three recommendations aimed at increasing transparency: streamlining and consolidating performance measures; enhancing record-keeping of methodology; and calling on the Housing Department to utilize “meaningful targets to provide context for reported results for key performance measures in its different reporting platforms.”
But what constitutes a “meaningful target” is left vague, as to suggest that the auditors are no more concrete in their thinking than the Housing Department.
The two metrics that really matter
Allow me to offer, after years of covering housing policy, a simpler way to assess a region's housing affordability situation, and the role a housing department can play. It boils down to two metrics:
First, how many housing units are being permitted per 10,000 residents at the metro level? This can be derived from annual Census data. Second, what is the metro’s median home prices? Varying answers can be found on Zillow, Redfin, etc.
Houston is a metro that has done well on both these metrics. It’s comparable to San Jose, in that it is a hub for jobs and innovation, and actually had double San Jose’s population growth rate last decade. Yet the region’s housing prices were 19.4% below the national average, and at $325k, under 1/4th that of metro San Jose. This is because Houston has much higher permitting rates.

Credit: the Market Urbanist
The metro thus builds housing much more cheaply than San Jose, including affordable housing. According to Construction Coverage, the average cost per affordable unit was $198,074, or 13.5% cheaper than San Jose. It’s also been able to overcome NIMBY opposition to affordable projects. In 2015, Houston effectively ended veteran homelessness by building cheap units for over 3,000 veteran street dwellers.
Note that Houston does not accomplish all this with government bureaucracies that publish reports, host panels, and pass audits. The city and its surrounding suburbs don’t even have many standard regulations, such as zoning codes. That might be precisely why Houston builds so much housing cheaply.
These two metrics — how many units a metro builds and what their average cost is — should be the overarching metrics used in any conversation on housing. They should also, for that matter, be the two main statistics used by housing departments. Is the department bringing lots of units onto the pipeline in a cost-effective way? That would be the focus of any useful audit.
There may be other ways to judge the Housing Department’s efficacy, such as whether its homeless programs get people off the streets and back to work. But if the metrics have risen to 200 in number, that speaks of a mission creep that likely leads to high administrative costs.
Read more from the Market Urbanist here.
Related:
Twenty years of failure: Why SJ Housing Dept's 2003 Homelessness plan flopped
Maybe Houston's getting it right and the Bay Area is all wrong
California's "housing element": an over-faith in bureaucracy
Follow Opportunity Now on Twitter @svopportunity
Opp Now enthusiastically welcomes smart, thoughtful, fair-minded, well-written comments from our readers. But be advised: we have zero interest in posting rants, ad hominems, poorly-argued screeds, transparently partisan yack, or the hateful name-calling often seen on other local websites. So if you've got a great idea that will add to the conversation, please send it in. If you're trolling or shilling for a candidate or initiative, forget it.